Articles and Interviews

4 December 2012

Clearest evidence yet of polar ice losses

30 November 2012
After two decades of satellite observations, an international team of experts brought together by ESA and NASA has produced the most accurate assessment of ice losses from Antarctica and Greenland to date. This study finds that the combined rate of ice sheet melting is increasing.

The new research shows that melting of the Antarctic and Greenland ice sheets has added 11.1 mm to global sea levels since 1992. This amounts to about 20% of all sea-level rise over the survey period.

About two thirds of the ice loss was from Greenland, and the remainder was from Antarctica.

Although the ice sheet losses fall within the range reported by the Intergovernmental Panel on Climate Change in 2007, the spread of the estimate at that time was so broad that it was not clear whether Antarctica was growing or shrinking.

The new estimates are a vast improvement – more than twice as accurate – thanks to the inclusion of more satellite data, and confirm that both Antarctica and Greenland are losing ice.

The study also shows that the combined rate of ice sheet melting has increased over time and, altogether, Greenland and Antarctica are now losing more than three times as much ice, equivalent to 0.95 mm of sea-level rise per year, as they were in the 1990s, equivalent to 0.27 mm of sea level rise per year.

The 47 experts combined observations from 10 different satellite missions to reconcile the differences between dozens of earlier ice sheet studies and produce the first consistent measurement of polar ice sheet changes.

Earth observation satellites are key to monitoring the polar ice because they carry instruments that measure changes in the thickness of the ice sheets, fluctuations in the speed of the outlet glaciers and even small changes in Earth’s gravity field caused by melting ice.

As outlined in the paper ‘A Reconciled Estimate of Ice Sheet Mass Balance’ published today in Science, the researchers carefully matched time periods and survey areas, and combined measurements from European, Canadian, American and Japanese satellites.

The measurement were acquired by instruments such as the radar altimeters and synthetic aperture radars flown on ESA’s ERS-1, ERS-2 and Envisat missions from 1991.

“The success of this venture is due to the cooperation of the international scientific community, and to the provision of precise satellite sensors by our space agencies,” said Professor Andrew Shepherd from the University of Leeds and one of the leaders of the study.

“Without these efforts, we would not be in a position to tell people with confidence how Earth’s ice sheets have changed, and to end the uncertainty that has existed for many years.”

 
Ice loss and sea level rise

The study also found variations in the pace of ice sheet change in Antarctica and Greenland.

“The rate of ice loss from Greenland has increased almost five-fold since the mid-1990s.

“In contrast, while the regional changes in Antarctic ice over time are sometimes quite striking, the overall balance has remained fairly constant – at least within the certainty of the satellite measurements we have to hand,” said co-leader of the study Dr Erik Ivins from NASA’s Jet Propulsion Laboratory.

The Ice Sheet Mass Balance Inter-comparison Exercise is a collaboration between 47 researchers from 26 laboratories, supported by ESA and NASA.

Europe’s Global Monitoring for Environment and Security programme will continue to monitor changes in the polar ice sheets during the coming decades, with the SAR and radar altimeter sensors on the Sentinel-1 and Sentinel-3 satellite series, scheduled to be launched from 2013 onwards.


2

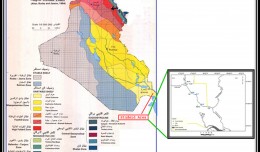
Determine the morphostructure phenomenon, East Khor Al-Zubair by Space Imageries

Dr.TorhanAlmofti *                                         Ahmed Ibrahim Saleh Al-Naemi** Abstract Through the use of satellite data taken by the Landsat satellites a color phenomenon was...
by Lamouchi Helmi
0


1

Detection and monitoring crop of wheat and barley by using NDVI stacking technique and spectral angle mapper algorithm

S K AAl-Hummadi[1] N S Nuaimy[2] A L Ubaidy[3] 1Ministry of science and Technology, ,Remote sensing center, Iraq E-mail: shathamaster@yahoo.com   2Ministry of science and Technology, Remote sensing center, Iraq E-mail: ade...
by Lamouchi Helmi
0


2

Tunisian economy in the face of the Covid-19 pandemic: State of play, analysis and outlook

Bouzayani Rajab [1]/ Abida Zouheir[2] [1] Bouzayani Rajab : Faculty of Economics and Management of Sfax, University of Sfax – Tunisia. E-mail: bouzayanilazher@gmail.com [2] Abida Zouheir : Faculty of Economics and Mana...
by Lamouchi Helmi
0


Thumbnail.8.640.360

Reducing Total Freshwater Use in the Gold Processing Industry Using Linear Programming

Suliman Emdini Gliwan*1 Kevin Crowe *2 *1Ph.D.Candidate, Faculty of Natural Resource Management, Lakehead University, 955 Oliver Rd, Thunder Bay, ON, Canada (P7B5E1). *2Associate Professor, Faculty of Natural Resource Managemen...
by Lamouchi Helmi
0


06-731x413

Control of a Hybrid Wind-PV and Energy Storage System

Control of a Hybrid Wind-PV and Energy Storage System Mohammed Al Busaidi, Amer Al-Hinai*, Rashid Al-Abri, Mohammed Al-Badi Electrical & Computer Engineering, Sultan Qaboos University, Oman Abstract—Distributed energy gen...
by Lamouchi Helmi
0


images

Modeling Ripeness Grading of Palm Oil Fresh Fruit Bunches through Image Processing using Artificial Neural Network

Modeling Ripeness Grading of Palm Oil Fresh Fruit Bunches through Image Processing using Artificial Neural Network Osama M. Ben Saaed1, Meftah Salem M Alfatni1,2*, Abdul Rashid Mohamed Shariff3 and Hadya S Hawedi1 1Faculty of I...
by Lamouchi Helmi
0


maxresdefault

DETECTIONS OF BUILDINGSDIGITAL SURFACE MODELS DEFORMATIONS GENERATED FROM DRONES NADIR IMAGES

  DETECTIONS OF BUILDINGSDIGITAL SURFACE MODELS DEFORMATIONS GENERATED FROM DRONES NADIR IMAGES Jean A. Doumit*, Souhail F. Awad*,Evgeny N. Kiselev** *Lebanese University, Faculty of Letters and Human Sciences, Department of g...
by Lamouchi Helmi
0


Prezentacja programu PowerPoint

Comparative responses to cadmium toxicity of Arabidopsis thaliana mutant seedling (cad2) and wild type (col0)

Comparative responses to cadmium toxicity of Arabidopsis thaliana mutant seedling (cad2) and wild type (col0) CHAFFEI HAOUARI CHIRAZ1, SLATNI TARAK2, DJEMAL FATMA1, GOUIA HOUDA1 (Company / Faculté des Sciences de Tunis) 1Unive...
by Lamouchi Helmi
0


1320_effects-image

Precision Technologies Role in the Study of Climate Change Impact

The Second session of the International Symposium Precision Technologies Role in the Study of Climate Change Impact and its implications on the Economic and Natural Structure: The reality and suggested solutions Istanbul, Turke...
by Lamouchi Helmi
0


f0ecbd2a-2ed9-458d-91ab-07e1caedea10-9867cc4df536.small

5th International Conference on Water, Energy, Food and Agricultural Technology Istanbul, Turkey, 22-25 January 2019

5th International Conference on Water, Energy, Food and Agricultural Technology Istanbul, Turkey, 22-25 January 2019   Scientific themes 1-      water resources and desertification and agricultural techniques 2-   ...
by Lamouchi Helmi
0


wwwwww

Drone base multiscale Digital Surface Models to planar areas.

Drone base multiscale Digital Surface Models to planar areas. Dr. Jean A. Doumit   Abstract The obtaining of a Digital Surface models (DSMs) at different scales and levels before the appearance of Unmanned Aerial Vehicles (UAV...
by Lamouchi Helmi
0


1

Monitoring of Mosul Reservoir Using Remote Sensing TechniquesFor the Period After ISIS Attack in 9 June 2014

Monitoring of Mosul Reservoir Using Remote Sensing TechniquesFor the Period After ISIS Attack in 9 June 2014 Lecture:  Muthanna Mohammed Abdulhameed AL Bayati University of Technology – Baghdad- Building and Construction Dep...
by Lamouchi Helmi
0


0 comments »


Be the first to comment!


Leave a Reply

Your email address will not be published. Required fields are marked *

*

* Copy This Password *

* Type Or Paste Password Here *

You may use these HTML tags and attributes: <a href="" title=""> <abbr title=""> <acronym title=""> <b> <blockquote cite=""> <cite> <code> <del datetime=""> <em> <i> <q cite=""> <strike> <strong>