This past spring and summer, NASA DEVELOPstudent interns used NASA’s Earth Observing System to examine spectral characteristics of dust storms in the Middle East. The results of this study aided project partners by implementing the use of remote sensing to enhance their current methodologies.
The Concern
Desert dust is made airborne every year during desert storm events globally. Arid areas, like those found in Iraq and Kuwait, have a high content of fine, easily suspended particles in their topsoils and are among the largest sources of airborne dust on the Earth [1]. According to the Environmental Protection Agency (EPA), airborne particulate matter below 2.5 micrometers (μm) can cause long term adverse health effects to the human respiratory system and overall health. Dust storms typically include both coarse and fine particulate matter. However, it is generally accepted in aerosol science that larger particles settle near the dust storm source and finer particles (like particulate matter below 2.5 μm) stay suspended in the air for longer allowing them to travel farther from their source. Previous studies have shown that particles 2.5 μm in diameter and smaller (PM 2.5) can penetrate into the lungs efficiently [2].
It is well known that airborne particulate inhalation is linked to a variety of respiratory diseases. Dust influx from the Sahel and Sahara to the Caribbean and Aral Sea is associated with some of the highest recorded incidence of asthma on the planet [3]. There are many other known health hazards of dust inhalation, including Desert Storm Pneumonitis, a disease caused by inhaling desert soils containing pigeon fecal material; desert lung syndrome, caused by the deposition of sand silica in the lungs; and Hantavirus, which is typically transported in dust [4]. However, the pathogenic effect of dust inhalation on respiratory tissues is attributed primarily to direct physical action of the dust particles on the epithelium of human airways and is exacerbated by toxic effects of trace elements and biologically active compounds that the dust particles may carry [1]. There is limited research regarding the mobility and extent of the transportation of pathogenic dust around the planet and not much is known about the impact of pathogenic dust on exposed populations.
Recently, project partners’ concerns about desert dust and inhalation exposure grew upon discovering that American soldiers returning from duty in the Middle East were experiencing new-onset respiratory disorders and were unable to meet physical fitness requirements. In 2011, King et al. performed a study that examined 49 previously healthy soldiers with unexplained exertional dyspnea and diminished exercise tolerance after deployment in Iraq and Afghanistan. The study found that 38 of the 49 soldiers suffered from diffused constrictive bronchiolitis which may have resulted from inhalation exposure [5]. In addition, the partners of this project conducted ground-based studies in Iraq revealing the presence of human pathogens in airborne dust. While ground-based studies are necessary for thorough examination of pathogenic materials in dust, the use of satellite remote sensing can enhance the process.
Remote sensing can monitor many of the factors affecting dust and microbial transport, such as precipitation, wind strength and wind direction; large-scale dust events visible from space are believed to have the biggest impacts on the biology and ecology of downwind ecosystems [6]. Since desert dust can be transported over long distances from the dust source region, satellite data can improve the detection of dust sources and the monitoring of dust transport and final deposition. Previous research shows that due to the large spatial distribution and the heterogeneous aerosol field over areas affected by dust plumes, ground-based measurements are not capable of monitoring the whole dust cycle alone, and a combination of ground-based and satellite observations is usually required [4].
The Science
NASA’s Earth Observing Systems (EOS)can determine the depth of dust plumes, as well as dust particle sizes. Comparisons of dust particle sizes from the Sahara and Arabian Deserts gives insight into the composition and atmospheric transport characteristics of dust from each desert. In this project, dust particle sizes were estimated using the Angström Exponent from NASA Sea-viewing Wide Field-of-view Sensor (SeaWiFS) DeepBlue Aerosol. Additionally, the Brightness Temperature Difference (BTD) equation was used to determine the distribution of particle sizes and the area of the dust storm. The Moderate-resolution Imaging Spectroradiometer (MODIS) on Terra satellite was utilized in calculating BTD.
The DEVELOP Middle East Public Health and Air Quality Team identified two dust storms occurring on two separate occasions to roughly estimate the size and distribution of dust particles. This study provides project partners with the means to monitor particle transport using NASA Earth observations and enhances future research pertaining to the impact of dust on human health.
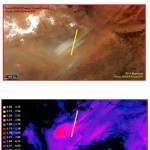
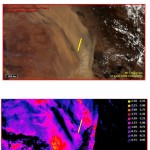
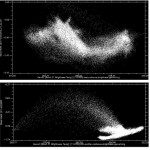
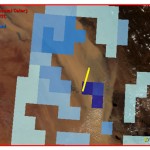
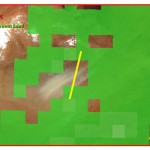
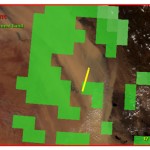
The first analysis completed was to identify a dust storm in each desert. To accomplish this, the team used the “split-window difference,” which is a common way to detect dust over land or water. The split-window difference, also known as the Brightness Temperature Difference (BTD), uses the difference in brightness temperature between the 11 micrometer channel and the 12 micrometer channel. Using MODIS data, the team subtracted MODIS Band 32 (11.770-12.270μm) from MODIS Band 31 (10.780-11.280μm). Once that step was completed, the team identified two separate dust storm occurrences. The first dust storm occurred June 7, 2003 in the Sahara Desert (Figure 1) and the second dust storm occurred April 17, 2008 in the Arabian Desert (Figure 2). Dust absorbs more radiation at 12μm than 11μm, thus making the difference negative. The resulting scale from the Arabian dust storm ranged from -2.50 K to -2.25 K, which represents the difference of the two bands in Kelvin. Likewise, the Saharan dust storm BTD returned negative values ranging from -1.75 K to -1.50 K. The larger the negative number is, the larger the dust load is within the storm. The next step was to take the calculated BTD and compare it to the brightness temperature of MODIS band 31 (Figure 3). This comparison shows that a good proportion of pixels have negative BTD values.
In order to estimate the dust load of each dust storm, the DEVELOP team used Aerosol Optical Depth (AOD) measurements. Since aerosols in the air originate from a number of different natural and human-induced sources, the AOD can measure overall air quality and visibility. Calculating the AOD helps validate the BTD, i.e., if the visibility is low then it is likely that suspended particles are in the air indicating a dust storm. In other words, the higher a unitless AOD value is, the more visibility is decreased. For example, an AOD value of zero corresponds to excellent visibility, while an AOD value of 3.0 is associated with very low visibility.
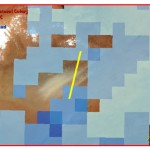
The AOD value is a pre-calculated product offered by a variety of satellite sensors. For this project, the Middle East Public Health and Air Quality team used the pre-calculated AOD product from NASA’s SeaWiFS instrument. The resolution of the aerosol data from SeaWiFS is 0.5 degrees. The AOD for the Sahara case study on June 7, 2003 (Figure 4) had values ranging from 1.0 to 2.5 which indicate decreased visibility. The AOD for the Arabian case study on April 17, 2008 (Figure 5) had values ranging from 1.0 to 3.5, which indicates low to very low visibility.
For this study, estimated particle sizes for aerosols within each of the dust storms were retrieved from another pre-calculated product from SeaWiFS, the AngströmExponent. The AngströmExponent is an exponent that expresses spectral dependence of aerosol optical thickness with the incident of light at the two different wavelengths and the wavelength values separately, in micrometers.
The AngströmExponent makes possible the estimation of particle sizes based on how large or small the output from the above described inputs. The larger the output number is from the AngströmExponent, the smaller the estimated particle size. The results from the Sahara Desert show that the largest AngströmExponent value ranges from -1.0 to 0.5 ( = -0.35 σ = 0.06), indicating smaller particle sizes (Figure 6). These results show that fine particles, around 4.0μm,do exist within the April 17, 2008 dust storm, however fine particles are not very prevalent. Moreover, in the Sahara Desert, the largest AngströmExponent values are within the range of -1.0 to 0.0 ( = -0.21 σ = 0.07) indicating that fine particles, around 4.0 μm, exist in the Sahara Desert dust storm, as well (Figure 7).
The final results indicated, based on estimated particle sizes from the two separate dust storms in the Arabian Desert and Sahara Desert, similarities may exist within the two regions. The similarities in the AOD show that methodology like this can be used in a variety of arid locations when characterizing dust particles in dust storms over land.
The Benefit
The Middle East Public Health and Air Quality Team partnered with Dr. Mark Lyles (Captain), who holds theVADMJoel T. Boone Chair of Health and Security Studies of the U.S. Naval War College;and Dr. Dale Griffin, an environmental and public health microbiologist with the United States Geological Survey(USGS). Dr. Lyles provided guidance and support throughout the entirety of this project. Dr. Lyles’ recent research was the impetus for this project and it has helped shed light on an area of public health that was previously poorly understood. Our findings add weight to his hypothesis that the components present in airborne particulate matter may cause adverse effects tothehuman respiratory system, by offering a methodology to determine the size and transportation of dust with remotely sensed satellite data. In addition to being the source of much of the previous research cited within this study, Dr. Griffin has provided us with guidance related to the methodology of our project and provided us with insight into the process of dust sample collection currently used in much of his research. Dr. Griffin recently conducted research on the microbiological and public health implications of atmospheric dust transport as well as researchonthe global dispersion of dust storm associated microorganisms.
The Middle East Health and Air Quality team metwith projectpartners several times throughout both research terms. The results of this research are aerosol particle size analysis, dust storm mass, and Brightness Temperature Difference. Angström Exponent and Aerosol Optical Depth can contribute to dust storm analyses in ways that would otherwise be impossible using only ground-based methods of data collection. These findings broadenthe understanding of atmospheric transport of potentially pathogenic materials and pollutants detected in ground-based measurmentsof the project partners. These results can aid Dr. Lyles and Dr. Griffin in understanding the composition of Middle Eastern dust and how it may affect human respiratory health. The conclusions of these studies will provide some of the seminal work inthis emerging topic. Dr. Lyles and Dr. Griffin will be able to validate the results of their ground data through the use of NASA satellite data.As confidence grows in the spaceborne monitoring of aerosols, products like the ones demonstrated in this project might be useful in guiding decisions to limit or more proactively assess harmful aerosol exposures of military personnel in Southwest Asia.
References
[1] Leski, T. a, Malanoski, A. P., Gregory, M. J., Lin, B., & Stenger, D. a. (2011). Application of a broad-range resequencing array for detection of pathogens in desert dust samples from Kuwait and Iraq. Applied and environmental microbiology, 77(13), 4285–92. doi:10.1128/AEM.00021-11
[2] Prospero, J. M., Olmez, I., and Ames, M. (2001). Al and Fe in PM 2.5 and PM 10 suspended particles in south-central Florida: The impact of the long range transport of African mineral dust. Water, air, and Soil Pollution, 125, 291-317.
[3] Griffin, D., & Kellogg, C. (2004). Dust Storms and Their Impact on Ocean and Human Health: Dust in Earth?s Atmosphere. EcoHealth, 1(3), 284–295. doi:10.1007/s10393-004-0120-8
[4] Kaskaoutis, D. G., Prasad, a. K., Kosmopoulos, P. G., Sinha, P. R., Kharol, S. K., Gupta, P., El-Askary, H. M., et al. (2012). Synergistic Use of Remote Sensing and Modeling for Tracing Dust Storms in the Mediterranean. Advances in Meteorology, 2012, 1–14. doi:10.1155/2012/861026
[5] King, Matthew S.; Rosana Eisenberg, John H. Newman, James J. Tolle, Frank E. Harrell, Jr., Hui Nian, Mathew Ninan, Eric S. Lambright, James R. Sheller, Joyce E. Johnson, and Robert F. Miller 2011. Constrictive Bronchiolitis in Soldiers Returning from Iraq and Afghanistan. N Engl J Med 2011; 365:222-30.
[6] Kellogg, C.A. and D.W. Griffin, 2006. Aerobiology and the global transport of desert dust. Trends in Ecology and Evolution 21(11):638-644.
 English
  Français
  العربية

